Introduction
Marketing teams face a critical measurement blind spot. AI-powered platforms like ChatGPT, Perplexity, and Google AI Overviews now synthesize search results into single authoritative answers rather than listing links. Your brand can be the source an AI cites — and most users will never click through to verify it.
The numbers bear this out. Bain research shows 58.5% of Google searches end without any click to an external website. When an AI summary appears in results, only 8% of users click a traditional link — compared to 15% without one. Traditional SEO metrics like rankings, clicks, and impressions no longer capture the full picture.
This creates a measurement crisis. Brands investing in Generative Engine Optimization (GEO) need a framework that tracks visibility inside AI responses, not just inbound traffic. This article provides that framework: the right tools, key metrics, how to read results, and how to avoid common tracking errors — so you can present stakeholders with a defensible model of GEO performance.
TLDR
- GEO measurement requires tracking AI-specific signals: citation frequency, share of voice, and brand sentiment across ChatGPT, Perplexity, and Google AI Overviews
- Establish pre-campaign baselines for branded search volume, direct traffic, and current AI visibility before launch
- Track performance across three methods: AI platform visibility checks, GA4-based LLM referral analysis, and CRM self-reported attribution
- Healthy GEO means consistent citation growth, qualified referral traffic, and positive sentiment — raw mention counts alone tell you nothing
- Monthly visibility checks and quarterly content audits are the minimum monitoring cadence
Why GEO Demands a New Measurement Approach
SEO measurement centres on ranked positions where every brand gets a spot — first, fifth, or fifteenth. Generative engines synthesise a single authoritative answer. Your brand either appears in that answer or it doesn't. There is no position two in a ChatGPT response.
This structural difference makes traditional metrics obsolete. AI platforms paraphrase or summarise content without sending direct referral traffic. Click-through rates from AI-generated answers measure below 1%, yet 80% of consumers now rely on zero-click results for at least 40% of their searches — reducing organic web traffic by an estimated 15–25%.
That zero-click reality means click-based metrics consistently undercount GEO impact. Two data points illustrate the gap:
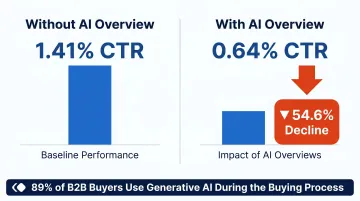
- When an AI Overview appears, organic click-through rates fall from 1.41% to 0.64% — a 54.6% decline
- 89% of B2B buyers use generative AI during the buying process, creating brand exposure that standard analytics tools never capture
Tools and Setup Required to Track GEO Performance
No single platform tracks GEO performance end-to-end. Effective measurement requires layering three categories of tools: analytics platforms, AI-visibility monitors, and CRM attribution.
Tools Required
Your core tracking stack should include:
- Google Analytics 4 — For AI referral traffic segmentation and landing page analysis
- Google Search Console — For branded query trends and indirect AI Overview signals (note: GSC currently lumps AI Overview impressions with traditional organic results without filtering)
- Third-party AI visibility platforms — Peec AI or Profound for cross-platform citation and sentiment monitoring
- CRM with custom attribution fields — For self-reported lead source data capturing "How did you hear about us?"
| Platform | Core Metrics | AI Engines Covered | Differentiator |
|---|---|---|---|
| Peec AI | Visibility, Position, Sentiment | ChatGPT, Perplexity, Gemini | Prompt-level analytics with country tracking |
| Profound | Answer Engine Insights, Agent Analytics, Prompt Volumes | 9+ platforms (incl. Grok, Meta AI, DeepSeek) | Full-stack with content creation agents |
For media publishers and content-driven brands, platforms like Publive connect GA4 and GSC through a unified analytics dashboard, consolidating these signals alongside Core Web Vitals and engagement data in one place. That consolidated view makes it easier to move into the next phase: establishing your pre-campaign baseline.
Preconditions and Baseline Setup
Before launching any GEO campaign, record baseline values for:
- Branded search volume — Via Google Search Console or Semrush/Ahrefs
- Direct traffic volume — Via GA4
- Manual AI visibility audit — Run 10–15 target branded and category prompts through ChatGPT, Perplexity, and Gemini; document current citation status
Next, configure GA4 for LLM traffic tracking:
Create a custom channel grouping using source-matching regex that captures traffic from:
- chatgpt.com, chat-gpt.org, openai.com
- claude.ai, anthropic.com
- perplexity.ai
- gemini.google.com, bard.google.com
- copilot.com, copilot.microsoft.com, bing.com/chat
- deepseek.com, you.com, phind.com, grok.x.com
Critical: Reorder the channel list so GA4 processes LLMs before the Referral channel to avoid misattribution. Without this setup, GA4 classifies AI traffic as generic "Referral," making it invisible.
Methods to Measure GEO Campaign Success
The three methods below work as complementary layers. Each one captures a different dimension of GEO performance — use all three together for an accurate read.
Method 1: AI Platform Visibility Tracking (Citations, Mentions, and Share of Voice)
Tracks how often and how prominently your brand is cited in AI-generated responses across ChatGPT, Perplexity, Gemini, and Google AI Overviews — the clearest measure of GEO effectiveness.
Tools Needed: Third-party AI visibility platforms (Peec AI, Profound) for automated monitoring; manual prompt testing for teams without budget.
Step-by-Step:
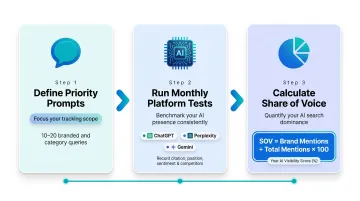
- Define 10-20 priority prompts spanning branded queries ("Tell me about [Brand]") and category/intent queries ("What are the best platforms for X in Y industry?"); log them in a shared tracking document
- Run prompts monthly through each target AI platform, recording whether your brand is cited, its position in the response, tone/sentiment, and which competitors appear
- Calculate Share of Voice (SOV) as (Your Brand Mentions / Total Mentions) × 100; track this trend line over time as your primary GEO KPI
Pros: Most direct view of GEO effectiveness; links directly to brand authority signals
Cons: Manual monitoring is time-intensive; AI responses vary by session, so results benefit from averaging across multiple runs
Method 2: Analytics-Based LLM Traffic and Engagement Measurement
Measures website traffic, landing page behaviour, and conversions attributable to AI platform referrals — connecting GEO visibility to bottom-of-funnel outcomes.
Tools Needed: Google Analytics 4 with custom LLM channel group; Google Search Console for branded query trend data.
Step-by-Step:
- In GA4's Traffic Acquisition report, filter by the custom LLM channel grouping to isolate AI-referred sessions by source; identify top landing pages to infer which content AI platforms cite
- Track engagement quality metrics — engagement rate, session duration, pages per session, key event completions — for LLM traffic and compare against organic and direct benchmarks
- Monitor branded search volume trends in Google Search Console monthly; a sustained lift in branded queries following GEO content investments is a strong proxy indicator that AI visibility drives awareness even when direct attribution is unavailable
Benchmark to watch: AI-referred visitors spend 8% longer on site and view 12% more pages compared to traditional search traffic, but convert at a 9% lower overall rate — indicating high research intent that requires nurture optimisation.
Pros: Most data-rich method; integrates with existing reporting workflows
Cons: AI platforms often don't send direct referral traffic (especially ChatGPT desktop), so analytics structurally undercount total GEO influence
Method 3: Self-Reported and CRM Attribution
Captures GEO-influenced leads and pipeline that analytics tools miss entirely — the "dark funnel" effect where prospects discover a brand via AI but arrive through direct traffic or branded search.
Tools Needed: Open-ended "How did you hear about us?" field on all lead gen forms; mandatory attribution field in CRM.
Step-by-Step:
- Add an open-ended field (not dropdown) to all contact forms; open-ended responses capture specific answers like "ChatGPT recommended you" that preset lists miss
- Create a CRM report filtered by AI-sourced attribution responses; track volume over time and compare lead quality (conversion rate, deal size, sales cycle length) for AI-attributed leads against other channels
Why this matters: 75%+ of the B2B path to purchase is "dark funnel". Users ask LLMs for recommendations, form shortlists inside AI conversations, then arrive at brand sites through branded search or direct URL entry. Attribution software logs this as "organic" or "direct," missing the AI-driven demand creation moment entirely.
Pros: Captures attribution that no analytics tool can — essential for understanding GEO's true business impact
Cons: Depends on human input, so data quality requires consistent form and CRM hygiene
How to Interpret Your GEO Metrics
GEO metrics only tell a complete story when read together. A spike in AI referral traffic means little if brand sentiment is negative. SOV growth matters only when it connects to business outcomes — pipeline, conversions, or branded search lift. Reading one signal in isolation is how campaigns get misdiagnosed.
Green Zone (Healthy GEO Performance)
What to look for:
- Month-over-month increase in AI citation frequency across target prompts
- Growing brand SOV relative to competitors
- AI referral traffic showing higher engagement rates than site average
- Measurable lift in branded search volume since GEO investment began
- Leads actively self-reporting AI platforms as their discovery source

Actionable next steps:
- Double down on content formats and topics being cited
- Expand prompt coverage testing to adjacent categories
- Document which content structures (FAQs, research, explainers) drive citations
Yellow Zone (Early Warning Signs)
Indicators requiring attention:
- Flat or inconsistently appearing citations across platforms
- AI platforms citing your brand but misrepresenting key information (wrong product category, outdated claims, competitor confusion)
- AI referral traffic with high bounce rates suggesting content-intent mismatch
Corrective actions:
- Update and clarify source content
- Add structured data — FAQ schema and How-To markup are the most impactful starting points
- Strengthen E-E-A-T signals on cited pages by surfacing author credentials, publication dates, and clear source attribution
Red Zone (Underperformance Signals)
Critical warning signs:
- Target queries consistently return competitor-dominated responses with no brand mention
- AI platforms display inaccurate or negative sentiment about the brand (45% of AI answers have significant issues)
- Zero growth in direct traffic or branded search despite campaign activity
- No self-reported AI leads over an extended period
Escalation actions:
- Audit content structure and topical authority gaps
- Review whether content is accessible to AI crawlers (robots.txt, sitemap inclusion)
- Consider whether the right prompt set and topics are being targeted
- Verify content accuracy — 58% of shoppers lose trust when AI provides incorrect brand information
Common Mistakes and Best Practices in GEO Measurement
Consequential Measurement Pitfalls
1. Measuring GEO only through GA4 traffic — Concluding GEO isn't working because LLM referral numbers are small ignores the dark funnel entirely. Users discover brands via AI and arrive through branded search or direct URL.
2. Starting GEO without pre-campaign baselines — Makes it impossible to demonstrate lift. Always document branded search volume, direct traffic, and current AI citation status before launch.
3. Running prompt tests once — AI responses vary significantly by session. Test repeatedly and average results for reliable data.
4. Tracking mentions without sentiment — Missing cases where AI represents your brand inaccurately or negatively. Monitor factual accuracy alongside frequency.
Sustainable Monitoring Cadence
| Frequency | Activities |
|---|---|
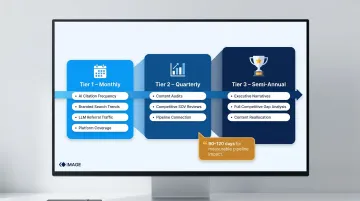
| Monthly | AI citation frequency; branded search volume trends; LLM referral traffic; platform-by-platform coverage |
| Quarterly | Content audits for topical gaps; competitive SOV reviews; connect AI visibility to pipeline indicators |
| Semi-Annual | Executive trend narratives; full competitive gap analysis; reallocate content based on citation performance |
Plan for a longer runway than most teams expect. Initial AI citations typically appear within 1–2 weeks of publishing optimised content, but measurable pipeline impact usually requires 90–120 days of consistent activity.
Connect GEO Measurement to Content Decisions
GEO reports should directly inform content investment. If a specific format (original research, structured FAQs, authoritative explainers) drives the majority of citations, reallocate resources toward that format. Technical infrastructure also matters here: platforms that achieve high Core Web Vitals scores — Publive, for instance, records a 98% Core Web Vitals pass rate across its hosted network — remove a common barrier to AI content crawling and citation eligibility.
Report GEO in Business Terms
Translate citation frequency and share of voice into brand awareness reach estimates. Connect AI-attributed leads to pipeline value. Reporting GEO in revenue terms — not just visibility metrics — is what earns sustained investment from leadership.
Frequently Asked Questions
How do you measure the success of generative engine optimization campaigns?
GEO success is measured through three complementary methods: AI platform visibility tracking (citation frequency, share of voice), GA4-based LLM referral traffic and engagement analysis, and self-reported CRM attribution. No single tool captures the full picture.
How is measuring GEO success different from measuring SEO success?
SEO measures ranked positions, impressions, and click-through rates in traditional search results. GEO measures citation frequency in AI-generated answers, brand sentiment accuracy, share of voice versus competitors in AI responses, and downstream signals like branded search lift.
What tools are best for tracking GEO campaign performance?
The core stack includes GA4 for LLM referral traffic segmentation, Google Search Console for branded query trends, third-party AI visibility platforms like Peec AI or Profound for cross-platform citation monitoring, and a CRM with open-ended lead attribution fields.
What is AI share of voice and why does it matter for GEO?
AI share of voice measures the percentage of relevant AI-generated responses that mention your brand compared to competitors. It's the GEO equivalent of search ranking position, showing whether you're winning or losing visibility in the AI discovery layer.
How often should GEO performance be reviewed?
Monthly reviews for citation frequency, branded search volume, and LLM traffic are essential. Quarterly content audits close topical coverage gaps. AI platforms update their training data and ranking signals frequently — reviewing less often than monthly means you'll likely act on outdated signals.
Why doesn't all GEO-driven traffic show up in analytics, and how do you account for it?
Users who discover brands via AI often arrive via direct URL or branded search rather than clicking AI-provided links, a pattern commonly called the "dark funnel." Self-reported lead attribution in forms and CRM fields is essential to capture GEO's full influence that analytics tools systematically miss.