For publishers, this change hits particularly hard. News and media sites run dozens of third-party scripts—ad networks, analytics, comment platforms, video players, social widgets. These scripts create exactly the kind of interaction delays INP now penalises. With only 37% of mobile sites using analytics and ad scripts achieving "good" INP scores, publishers face a disproportionate burden.
The stakes are real: poor INP scores can reduce search visibility, lower engagement metrics, and compound ranking damage. For Indian publishers serving mobile-heavy audiences on mid-range devices, the challenge is even more severe.
TLDR:
- INP measures latency for every interaction (clicks, taps, keystrokes), not just the first one
- Publishers face unique INP challenges: third-party ad scripts, mobile audiences, and content-rich pages
- "Good" INP requires under 200ms response time; above 500ms is "Poor"
- Fix it by auditing third-party scripts, yielding to the main thread, and optimising DOM complexity
What Is INP, and Why Did Google Replace FID With It?
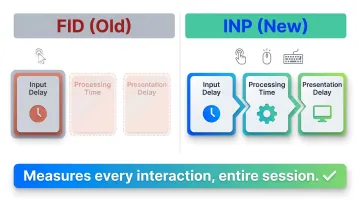
Interaction to Next Paint (INP) observes the latency of every click, tap, and keystroke a user makes on a page, measuring the time from input to when the browser paints the next visual frame. It then reports the worst-performing interaction (excluding outliers) as the page's final score.
The Three-Phase Anatomy of an Interaction
INP captures three distinct components:
- Input delay: Time before event callbacks start running
- Processing time: Time for all callbacks to execute
- Presentation delay: Time until the new frame is rendered on screen
FID measured only the first component (input delay) and only for the very first interaction. INP measures all three phases for every interaction throughout the entire page session.
Why the Switch Was Necessary
Chrome data shows users spend 90% of their time on a page after it loads. FID captured only the first click, which happens during the remaining 10%. A site could pass FID easily while delivering dozens of sluggish interactions throughout the session.
What INP Measures (and Doesn't)
INP tracks:
- Mouse clicks
- Touchscreen taps
- Keyboard presses
INP excludes:
- Hovering
- Scrolling
- Zooming (unless done via keyboard)
This distinction matters: optimise for clicks, taps, and keystrokes—not scrolling performance.
How the Final INP Value Is Calculated
INP uses the worst interaction observed, ignoring one outlier per 50 interactions. The value reported in field data (Chrome User Experience Report) is taken at the 75th percentile of all page views. For publishers running ad-heavy article pages, one sluggish interaction — a sticky nav click, a paywall modal tap — is enough to drag down the score for your entire domain.
Why Publishers Face Unique INP Challenges
Publisher sites are structurally more exposed to poor INP than static landing pages or product pages. A typical news article fires dozens of third-party scripts on load—ad networks, analytics, social widgets, comment platforms, video players. All compete for main-thread time, inflating input delay when a reader interacts.
Ad-Heavy Monetisation Directly Conflicts With INP
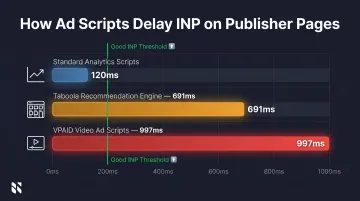
Programmatic ad scripts are among the most common causes of long tasks that block the main thread. Pages using user behaviour scripts (analytics, ad tracking) achieved only 37% "good" INP on mobile, compared to 74% for all websites. Header bidding wrappers, ad refresh scripts, and video ad SDKs create main-thread congestion that delays visual feedback.
The Taboola case study quantifies this precisely: their old recommendation engine blocked the main thread for up to 691ms per script. VPAID video ad scripts caused delays of 997ms. These single scripts exceed the 200ms "good" threshold by 3x to 5x.
Mobile Audiences Face Significantly Worse INP
Readers in markets like India predominantly use mid-range Android devices with lower CPU and memory capacity. Only 74% of mobile websites achieved "good" INP globally in 2024, compared to 97% on desktop—a 23-percentage-point gap.
For Indian publishers, this gap is compounded by audience behaviour: mobile accounts for 70.5% of web traffic in India, with the Reuters Institute reporting a "strong preference for smartphones to access news". Your majority audience is experiencing the worst INP performance.
Content Complexity and CMS Constraints Compound the Problem
Beyond ad scripts, two structural factors push INP scores further into "needs improvement" territory:
- Rich media embeds — tweets, Instagram posts, interactive maps, and auto-play videos add DOM complexity and inflate presentation delay, the third INP component. Each element forces the browser to recalculate layout and repaint after every interaction.
- CMS architecture limits — general-purpose CMS platforms often ship with large DOM trees, unoptimised event listeners, and synchronous JavaScript. These platform-level constraints set a performance ceiling that individual tweaks can't break through.
Publishers running ad-heavy, media-rich sites on legacy CMS platforms face all three problems simultaneously — and that combination is why so many news sites cluster in the "needs improvement" band even after targeted fixes.
What INP Thresholds Mean for Your Search Rankings
Google defines three INP rating buckets:
| Rating | INP Value | Measured At |
|---|---|---|
| Good | ≤ 200ms | 75th percentile of page loads |
| Needs Improvement | 200–500ms | Mobile and desktop segmented |
| Poor | > 500ms | Based on field data (CrUX) |
What "Needs Improvement" or "Poor" Means in Practice
Google's documentation states that "core ranking systems look to reward content that provides a good page experience." Core Web Vitals, including INP, function as a tiebreaker. Two pages with similar content quality can be separated by their INP score.
Poor INP frustrates users directly — they abandon pages faster, which signals low engagement to Google and amplifies ranking damage over time.
Field Data vs. Lab Data
Google uses field data from the Chrome User Experience Report (CrUX) for ranking decisions. Lab tools like Lighthouse simulate interactions but don't capture real-world variability. For INP specifically, this means a Lighthouse score won't move the needle on rankings — only what real users experience, captured through Real User Monitoring (RUM), feeds into CrUX and ultimately affects how Google evaluates your pages.
How to Measure Your Site's INP
Use these tools to track INP performance:
Primary Field Data Sources:
- Google Search Console surfaces URL-level field data in the Core Web Vitals report, segmented by mobile and desktop — once your site collects enough traffic to qualify
- PageSpeed Insights combines CrUX field data with Lighthouse lab results for any individual URL
- Chrome User Experience Report (CrUX) tracks origin-level trends over time, useful for spotting regressions across publishing cycles
Interaction-Level Diagnosis:
- Real User Monitoring (RUM) tools pinpoint which specific element — a hamburger menu, share button, or comment trigger — is causing the worst latency for actual users
- Web Vitals Chrome Extension lets editors and developers debug interactions directly in the browser during reviews
Lab Proxy When Field Data Isn't Available:
If your site doesn't qualify for CrUX data (insufficient traffic), use Total Blocking Time (TBT) in Lighthouse as a proxy. TBT correlates strongly with INP — making it a reliable stand-in during pre-launch testing or when stress-testing new article templates before rollout.
How Publishers Can Improve INP: A Practical Approach
Audit and Manage Third-Party Scripts
This is the highest-impact lever for publishers. Audit which third-party scripts fire event listeners on interactive elements. Defer or lazy-load non-critical scripts—analytics pixels, social embeds, ad refresh scripts. Evaluate whether each script earns its performance cost.
A single heavy ad SDK firing synchronously can push INP above 500ms. After redesigning their recommendation engine and implementing smart yielding, Taboola reduced publisher INP by up to 36%.
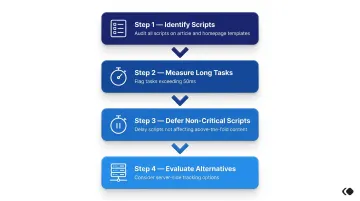
Action steps:
- Identify all third-party scripts on article and homepage templates
- Measure which scripts generate long tasks (>50ms)
- Defer scripts that don't affect above-the-fold content
- Consider server-side alternatives for non-essential client-side tracking
Yield to the Main Thread
Long JavaScript tasks block the browser from responding to user input. Break up tasks exceeding 50ms using scheduler.yield() (available in Chrome 129+, Edge 129+) or setTimeout(0) for cross-browser compatibility.
This is especially relevant for JavaScript-heavy features like comment systems, live blog updates, or real-time notifications.
Reduce DOM Size and Rendering Complexity
Large news homepages or article pages with hundreds of components increase presentation delay—the time to calculate and paint layout changes after an interaction.
Strategies:
- Use CSS content-visibility: auto for below-the-fold content (delivers up to 7x rendering performance improvement)
- Limit unnecessary DOM depth in article templates
- Lazy-render components that aren't immediately visible
Prevent Interaction Overlap on Infinite Scroll Pages
On pages with infinite scroll or auto-loading content, subsequent content loads can overlap with reader interactions, causing the browser to delay processing user input.
Solutions:
- Debounce event handlers to prevent excessive firing
- Prioritise user interactions over background content fetching
- Cancel stale network requests to free up main-thread capacity
Evaluate Your CMS Architecture
Your CMS determines the baseline INP ceiling. A platform that generates lean HTML, avoids synchronous render-blocking JavaScript, and ships minimal unused code per page gives you a structural INP advantage from day one. This matters more than any single optimisation — architectural debt accumulates faster than it can be patched.
The Economic Times reduced Total Blocking Time by 30x and INP by nearly 4x by migrating to Next.js, identifying unused code, and optimising DOM size. The result: a 50% decrease in bounce rate and 43% uplift in pageviews.
Frequently Asked Questions
What replaced First Input Delay in Core Web Vitals?
Interaction to Next Paint (INP) officially replaced First Input Delay (FID) on March 12, 2024. INP measures all interactions throughout a session, while FID only measured the input delay of the first interaction.
What is a good INP score for a news or media website?
An INP below 200ms is "Good," 200–500ms is "Needs Improvement," and above 500ms is "Poor." News sites with heavy ad loads and third-party scripts often struggle to stay below 200ms on mobile.
Does INP directly impact Google Search rankings?
INP is part of Google's Page Experience signals and acts as a tiebreaker in rankings. Poor INP can disadvantage a site competing against similar-quality content, but content relevance still takes precedence — it's one signal among many.
How do ads and third-party scripts affect INP?
Programmatic ad scripts and third-party widgets are leading causes of main-thread congestion on publisher pages, inflating both input delay and processing time — the two INP components that ads most directly impact.
How can I check my website's current INP score?
Three tools cover most use cases:
- Google Search Console — Core Web Vitals report for real-user field data
- PageSpeed Insights — combined field and lab view in one place
- Web Vitals Chrome Extension — quick per-interaction debugging during live testing
Does INP affect Google News or Discover performance?
Google has not confirmed INP as a direct ranking factor specifically for Google News or Discover. However, poor Core Web Vitals scores can reduce a page's eligibility for enhanced features, making INP optimization strategically important for news publishers.