AI content creation platforms with real-time performance analysis solve this by closing the feedback loop: AI assists with drafting, optimisation, and repurposing, while integrated analytics surface live engagement signals—scroll depth, CTR, time-on-page—within minutes of publishing. For media houses publishing dozens of stories daily, and financial institutions where content accuracy impacts trust, this integration transforms reactive publishing into a data-informed, responsive editorial operation.
TLDR:
- Integrated platforms combine AI-assisted content creation with live performance monitoring to inform decisions as content goes live
- Real-time signals (scroll depth, CTR within minutes) enable editors to amplify winners and fix underperformers before traffic peaks
- Consolidation reduces tool sprawl and costs—teams using 25-60 separate tools see utilisation drop to 49%
- Publishers using real-time metrics achieved 20-300% engagement improvements (INMA case studies)
What Is an AI Content Creation Platform with Real-Time Performance Analysis?
These platforms integrate AI-assisted content generation—drafting, repurposing, optimisation—with live performance monitoring, so editorial decisions are informed by data flowing in as content publishes, not days later.
Gartner defines Content Marketing Platforms as systems that "collect and analyse data to inform content creation and reuse, streamline operations and iterate on content to improve marketing effectiveness." The category has matured rapidly: Gartner's October 2025 survey found 81% of martech leaders are piloting or have implemented AI agent initiatives, with the top use case being content or marketing asset production (52%).
Key Distinction: Native Integration vs. Tool Stitching
The critical difference is native integration that shares a live data layer between creation and analysis. Traditional workflows require:
- One tool to create content
- Another for SEO
- A third for analytics
- A fourth for distribution
Performance data must be manually exported, interpreted, and fed back into creation tools—a lag that makes real-time decisions impossible. Integrated platforms eliminate this gap by surfacing engagement signals directly within the editorial interface.
What "Real-Time" Actually Means
Per Google's official GA4 documentation, "Realtime" data processes in "typically a few minutes" and covers event and usage data from the last 30-60 minutes. Standard intraday processing takes 2-6 hours; full daily processing requires 12-24+ hours.
Data Latency Comparison:
| Data Source | Typical Latency | Coverage |
|---|---|---|
| GA4 Realtime | A few minutes | Limited dimensions/metrics |
| GA4 Standard Intraday | 2-6 hours | Most reports, limited attribution |
| GA4 Daily | 12-24+ hours | Full reports, full attribution |
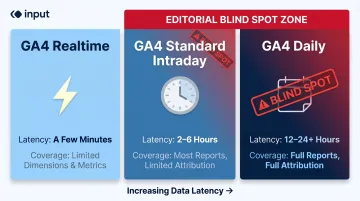
Platforms integrating GA4 Realtime can deliver near-instant engagement signals, while teams relying on standard processing face multi-hour blind spots where content cannot be optimised.
Primary Users Who Benefit Most
Those latency gaps hit some teams harder than others. The users with the most to gain:
- Media houses and digital publishers pushing 10-50+ pieces daily — real-time signals determine where promotion budgets go before traffic peaks fade
- Brand content teams with high publishing cadences — early performance data identifies winning topics while audiences are still active
- Financial and healthcare organisations — audience drop-off can signal confusing or non-compliant messaging that needs correction before it spreads; Siteimprove notes that GA4 Consent Mode can suppress up to 30% of data in regulated industries, making always-on monitoring essential
Why the Creation-to-Analysis Feedback Loop Is a Game Changer for Publishers
The Traditional Publishing Workflow Problem
Content is created, published, and reviewed after the fact. Poor-performing pieces drain distribution budgets while high-performers are identified too late to capitalise on momentum.
Standard GA4 processing delays — 2-6 hours intraday, 12-24+ hours for daily reports — create analytics blind spots during the precise window when content traffic peaks and decays. Teams on weekly or monthly review cycles discover winning content after its peak and keep distributing underperformers long past their useful life.
How a Closed Feedback Loop Changes This
When performance signals feed back into the creation workflow in real time, editors can:
- Amplify what's working (push notifications, social distribution, internal linking) while it's still relevant
- Fix underperformers immediately by updating CTAs, headlines, or intros before traffic peaks
- Feed accurate data into future content planning based on what audiences actually engaged with, not editorial instinct
INMA's 14-publisher case study research documents measurable outcomes:
| Publisher | Metric Shift | Outcome |
|---|---|---|
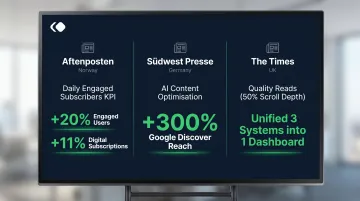
| Aftenposten (Norway) | Moved to "daily engaged subscribers" KPI (>20% content consumed) | 20% increase in daily engaged users; 11% increase in digital subscriptions |
| Sudwest Presse (Germany) | Deployed AI content optimisation tools | 300% increase in Google Discover reach |
| The Times (UK) | Introduced "Quality Reads" (50% scroll depth threshold) | Replaced three uncoordinated systems with one dashboard |
The Compounding Advantage for SEO and AI Search
Content that gets early engagement signals ranks faster. The DOJ antitrust trial revealed Google's internal system "NavBoost," which uses click data and user interaction signals — including clicks, dwell time, and pogo-sticking — as ranking factors.
Platforms that track GEO discoverability (how content performs in AI-generated search responses) give publishers an edge that purely retrospective tools miss. That edge is increasingly consequential: Pew Research Center found users clicked search results only 8% of the time when AI Overviews appeared, versus 15% without — a 46.7% relative reduction. Similarweb data shows zero-click searches rose from 56% to 69% between May 2024 and May 2025.
Academic validation: The Princeton/IIT Delhi GEO study tested 9 content optimisation tactics across 10,000 queries and found:
- Citations, statistics, and quotations each improved AI search visibility by 30-40%
- Keyword stuffing produced zero or negative impact
Editorial Velocity Challenge for High-Output Teams
News publishers and content-heavy brands can publish dozens of pieces per day. Without real-time performance data, resource allocation across stories becomes guessing.
Example scenario: A breaking news story begins gaining traction at 10 AM. Real-time signals show strong scroll depth (readers consuming >50% of content) but low social shares. The editor immediately triggers push notifications and social amplification while the story is trending. By the time standard GA4 intraday data arrives (2-6 hours later), the traffic spike has peaked and declined—the window to capitalise is closed.
Why This Matters for Regulated Industries
Financial institutions and healthcare organisations cannot afford delayed feedback. Content accuracy and engagement signals can flag when audiences disengage early—a potential indicator of confusing or non-compliant messaging.
Siteimprove's financial services research notes that 48-hour processing delays create compliance blind spots, and "inconsistent naming conventions or broken tags during site updates can lead to data drift, making reports unreliable for high-stakes decisions."
Core Features to Look for in These Platforms
What to Expect from the AI Content Creation Layer
Minimum viable creation features:
- Long-form drafting that produces coherent articles requiring minimal rewriting
- Headline generation with A/B or multivariate testing to route traffic to variations
- Content repurposing across formats—article to social post to push notification—maintaining brand voice
- Brand voice consistency enforcement so AI output aligns with editorial standards without heavy editing
Generating multiple headline or intro variations and routing traffic to each produces performance data directly, rather than waiting for organic signals. This compresses learning cycles from weeks to hours.
What to Expect from the Real-Time Analytics Layer
Essential real-time metrics tied to editorial decisions:
- Page views per minute to identify trending content before traffic peaks
- Scroll depth to measure how much content readers actually consume
- Time on page to distinguish skimmers from engaged readers
- Click-through rates on CTAs and internal links to optimise conversion paths
- Push notification open rates to calibrate distribution timing
- Social share velocity to spot viral potential early
These metrics are only actionable when they live in one place. A consolidated dashboard connecting GA4 and Google Search Console lets editors see which pieces are trending, which are underperforming against category benchmarks, and which need a distribution push — without switching between tools.
For media organisations and brands managing content at scale, Publive's unified platform connects AI content creation, real-time analytics, and distribution in a single interface. Its Golden Signals Dashboard surfaces GA4 and GSC insights without requiring analysts to manually stitch data — and with 99.995% uptime on AWS, those insights stay available even when a breaking story drives a traffic spike.
True integration means performance data can trigger content workflows: an automated alert that a high-traffic article needs an updated CTA, or that a topic cluster is gaining search traction and warrants additional coverage. That closed loop is what separates analytics-native platforms from tools that simply display data after the fact.
How the Feedback Loop Works in Practice
Concrete Editorial Workflow Example
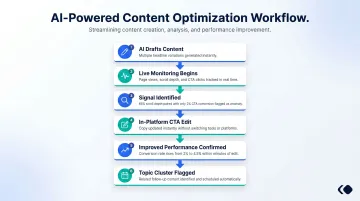
- Editor uses AI to draft and optimise a content piece with multiple headline variations
- System monitors engagement from the moment of publication—page views per minute, scroll depth, CTA clicks
- Real-time signals show strong scroll depth (65% average) but low CTA conversion (2%)
- Editor updates the CTA copy within the same platform—no tool-switching required
- Updated conversion rate (4.5%) appears in real-time dashboard within minutes
- Performance data flags this topic cluster as gaining traction—editor schedules follow-up content
How This Workflow Changes Content Planning
Performance data from live articles flows back into topic selection and brief creation. Future content is informed by what audiences actually engaged with—not what editorial instinct predicted.
The Quint's WAN-IFRA case study shows this in action: analytics flagged high traffic but weak post-landing engagement, so the team used scroll depth data to pinpoint reader drop-off points. They built an AI-powered "NewsEasy" widget offering summaries and key takeaways.
The pilot reported improved scroll depth, more time spent on page, and a 38% reduction in API token usage through batching and caching.
Push Notification and Social Distribution Layer
Those engagement signals don't just inform the next edit — they can trigger distribution. Platforms with integrated distribution tools auto-send audience notifications when a piece crosses a set engagement threshold, converting measured performance directly into wider reach without manual intervention.
The result: each content cycle feeds the next. What gets published informs what gets amplified, and what gets amplified shapes what gets created.
Common Mistakes Teams Make Without Integrated Analytics
The Tool-Sprawl Problem
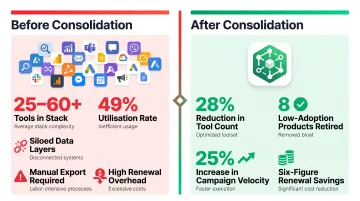
The martech landscape reached 15,384 solutions in 2025, a 100x increase since 2011. Most B2B marketing teams operate 25-60 tools, with enterprise environments exceeding 60-120+ tools.
The consequence: There is no shared data layer. Performance insights arrive too late to change live content decisions. Gartner's 2025 survey reports utilisation has dropped to just 49%—more than half of purchased martech capabilities go unused.
Documented case study: A 400-person B2B team cut total tool count by 28%, retired 8 low-adoption products, achieved a 25% increase in campaign velocity, and realised six-figure renewal savings (Pedowitz Group).
The Retrospective-Only Trap
Relying solely on weekly or monthly performance reviews means high-performing content is discovered after its peak and low-performing content continues consuming distribution resources.
The GA4 latency gap—2-6 hours for standard intraday processing, 12-24+ hours for full daily processing—creates an analytics blind spot during the critical window when content traffic peaks and decays. That delay compounds further when the analytics tool is separate from where content is created and published.
Brand Consistency Risk When AI Creation and Analytics Are Separated
Without performance feedback integrated into the creation tool, teams can't identify whether poor engagement stems from:
- Content quality issues
- Topic misfit
- Distribution failure
- Technical problems (slow load times, poor mobile experience)
Without that signal, every fix is a guess. Teams cycle through changes — rewriting copy, adjusting publish times, tweaking headlines — without knowing which variable actually moved the needle.
How to Choose the Right Platform for Your Team
Frame the Selection Around Three Core Questions
1. Does the platform treat content creation and analytics as native capabilities within one system, or as integrations bolted on afterward?
Native integration means a shared data layer where performance signals automatically inform content workflows. Bolt-on integrations require manual data export and create lag.
2. Does the real-time data surface where editorial decisions are made?
If editors must switch between a CMS for creation and a separate analytics tool for performance data, the feedback loop is broken. Look for platforms where engagement metrics appear directly within the editorial interface.
3. Does it scale with publishing volume without proportional cost increases?
Usage-based pricing models scale more efficiently than per-seat or per-site licensing. Platforms with auto-scaling infrastructure handle traffic spikes (breaking news, market events) without performance degradation or emergency infrastructure costs.
Evaluation Criteria for Media and Publishing Teams
High-frequency publishing support: Look for platforms that support 10-50+ pieces daily without performance degradation.
GA4 and GSC connectivity as standard: These should be included, not premium add-ons. Google Search Console introduced a "Recent Performance" view in December 2024 that displays data from the last 24 hours with only a few hours' delay—platforms integrating this provide near-real-time search visibility.
Core Web Vitals monitoring: Protect SEO performance by tracking LCP, CLS, and INP. As of March 2026, only 56.5% of all web origins pass Core Web Vitals; among the top 1,000 sites, mobile pass rates are only 40%. Built-in CWV monitoring provides a direct SEO advantage.
White-glove support: Given how operationally critical content infrastructure is, 24×7 support is essential for high-volume publishing operations.
For media organisations and brands managing content at scale, Publive's unified platform combines AI content creation, real-time analytics, and distribution tools with 99.995% uptime on AWS, designed to meet exactly this set of requirements.
Total Cost of Ownership Comparison
Teams using four or five separate tools for creation, SEO, analytics, distribution, and CMS often pay more in aggregate and suffer from data inconsistency.
Budget context: Gartner's 2025 CMO Spend Survey reports marketing budgets flat at 7.7% of company revenue, with 59% of CMOs reporting insufficient budget. Martech accounts for 28.9% of marketing budgets.
A consolidated platform reduces both cost and coordination overhead. Heinz Marketing reports that modern platform suites now handle 60-80% of a workflow, with vendors winning by "replacing three tools with one." Consolidation is measured across five dimensions:
- Fewer invoices and vendor contracts to manage
- Reduced security reviews and procurement cycles
- Fewer integrations to build and maintain
- Lower renewal tracking overhead
- Simplified internal IT coordination

The global martech market was worth $131 billion in 2023 and is projected to exceed $215 billion by 2028—yet utilisation remains under 50%, indicating significant waste that consolidation directly addresses.
Frequently Asked Questions
What is an AI content creation platform with real-time performance analysis?
It's a platform that integrates AI-assisted content generation (drafting, repurposing, optimisation) with live performance monitoring, allowing editorial teams to make data-informed decisions throughout the content lifecycle, not just at the end of it.
How does real-time performance analysis improve content strategy?
Live engagement signals — time on page, scroll depth, CTR — let editors act on what's working right now. They can amplify winning content faster, fix underperformers before audience drops off, and feed accurate data back into future planning. That eliminates the multi-hour (or multi-day) lag that makes traditional analytics reactive rather than useful.
What metrics should an AI content platform track in real-time?
Essential metrics include page views per minute, scroll depth, click-through rates on CTAs and internal links, push notification open rates, and social share velocity. The most useful platforms surface these in a single unified dashboard rather than requiring navigation across multiple tools.
How is using an integrated AI content and analytics platform different from using separate tools?
Integrated platforms share a live data layer between creation and analysis, enabling performance signals to automatically inform content workflows. Separate tools require manual export, creating lag that makes real-time decisions impossible and leaving teams without the context they need to act quickly.
Can smaller media teams benefit from AI content platforms with built-in analytics?
Yes — especially because smaller teams lack dedicated analysts. Having performance signals surfaced automatically within the publishing workflow reduces the expertise required to act on data and eliminates the need to maintain multiple tool subscriptions and integrations.
What should I prioritise when evaluating AI content creation platforms with real-time analytics?
Focus your evaluation on these areas:
- Native analytics depth — not just third-party integrations bolted on
- Publishing-volume scalability as your content output grows
- GA4 and GSC connectivity available as standard, not an add-on
- Core Web Vitals support built into the platform
- Closed-loop workflows where performance data directly informs content decisions